
Many times in trading we here the terms overbought and oversold. We hear an analyst state that the AUD/USD is overbought and due for a correction or that the EUR/CHF is oversold and due for a bounce. But how does one determine what is overbought and what is oversold and just what does that mean?
The terms are used to describe a market condition that is quantified by certain technical indicators. These indicators are called oscillators with two popular examples being the Stochastics and RSI. An oscillator is a commonly used momentum indicator that measures the current currency price compared to its historical price over a given time period. It looks to gauge the strength and momentum of a currency pair's move by measuring the degree by which a currency is overbought or oversold. The scale for the both indicators is 0 to 100. When Stochastics reaches a value of 80, the market is considered overbought and when Stochastics reaches a value of 20, the market is considered oversold. RSI uses the same scale of 0 to 100, but the value for overbought is 70, while the value for oversold is 30. The idea is when the market reaches either extreme, the chance for a reversal increases.
However, a reversal is not imminent.
Markets that are in a strong uptrend can remain overbought for long periods of time and markets that are in a strong downtrend can remain oversold for long periods of time. This is why these oscillators have limited value in trending markets. However, when the market is in a downtrend and the oscillator moves up to overbought, there is a much better chance of a reversal. On the flip side, when the market is in an uptrend and the oscillator moves down to oversold, there is also a good chance of a reversal.
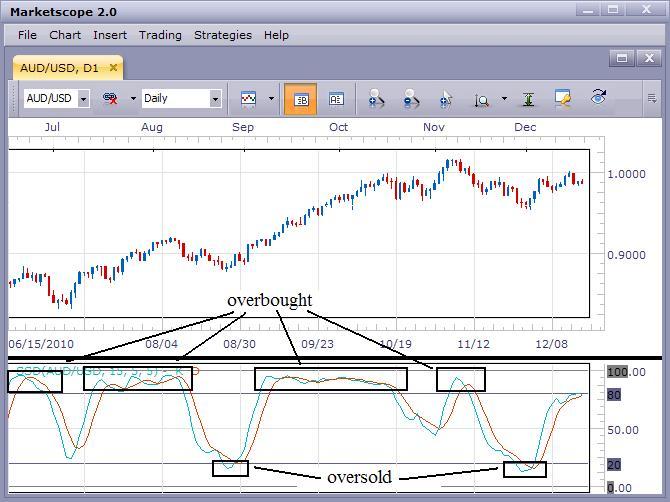
Here is an example using the daily chart of the AUD/USD. Also plotted on the chart is a Slow Stochastics using values of 15,5,5. You can see that while the market is in an uptrend, the Stochastics will spend more time in an overbought condition and little time in the oversold condition. This is typical in a strong uptrending market. Also, when Stochastics moves down to an oversold condition, the market has a tendency to reverse. This is one way some traders use this tool to identify a buying opportunity. But the key here is that the market is in an uptrend. If the market was in a downtrend, the opposite would be true and those same traders would treat a move up to overbought as a selling opportunity. So while oscillators can be valuable in identifying trading opportunities, it is the direction of the trend and trading in that same direction that increases the reliability of these tools.
No comments:
Post a Comment